

Where it went
See where it all went
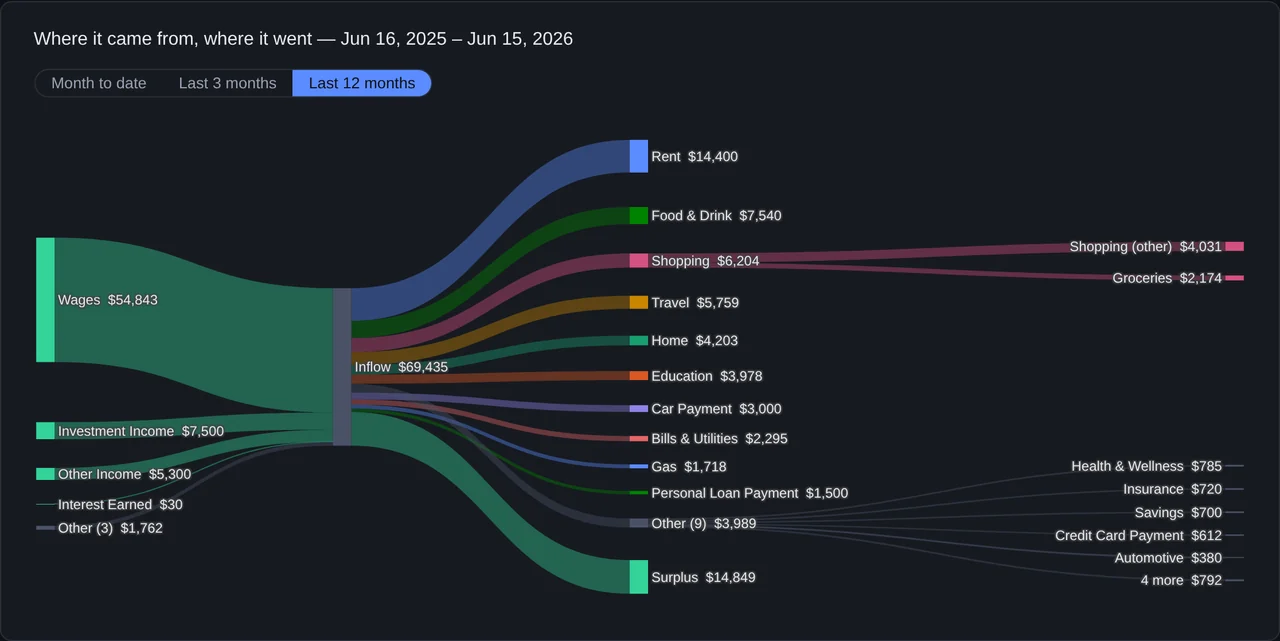
Every source of income on one side, everything it went to on the other, and what was left over at the bottom. For the month so far, the last three months or the last year.
A made-up household, the real report, and a two-minute guided tour.
All your accounts, as one
Rheograph treats all your accounts as one, so money moved between them cancels out and nothing is counted twice.
For example, a credit card purchase is spending the day you make it. Paying the credit card from checking later only moves money between your accounts; if you count that too, then the same purchases are counted twice.
Where it went
Every source of income on one side, everything it went to on the other, and what was left over at the bottom. For the month so far, the last three months or the last year.
This month
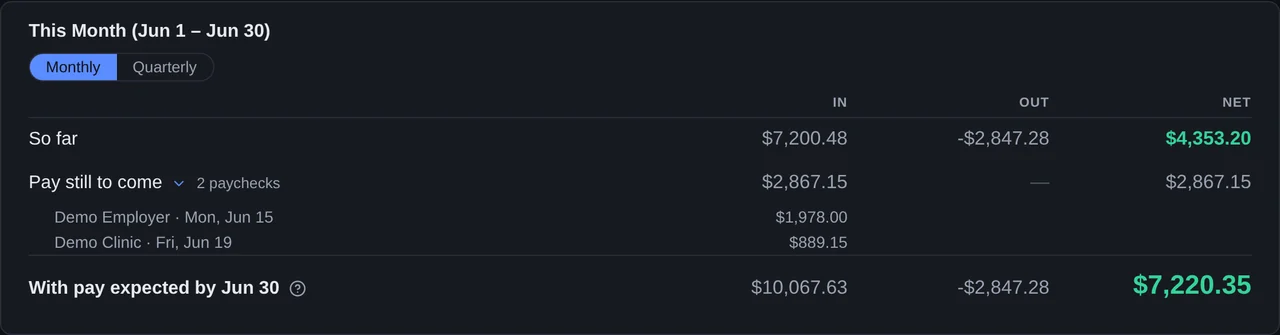
Each month opens with a short statement: what’s come in, what’s gone out, and the pay still to come, each employer’s next paycheck on its payday. The figure at the bottom is what the month will leave you, yours to save or to spend. One click shows the same for the quarter.
Spending pace
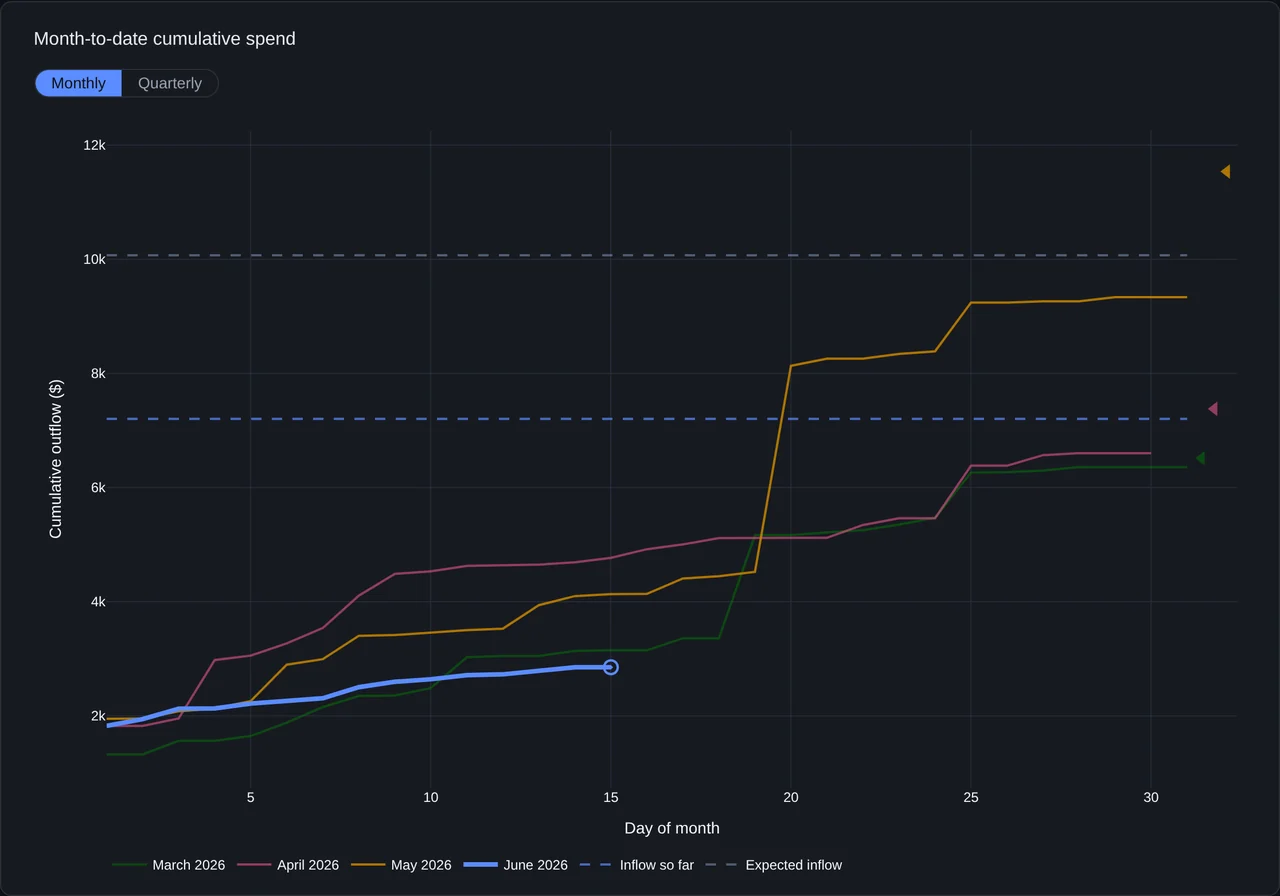
This month’s spending, day by day, against the months before it, with the income it shouldn’t cross. A heavy week shows up while there’s still time to do something about it.
Net worth
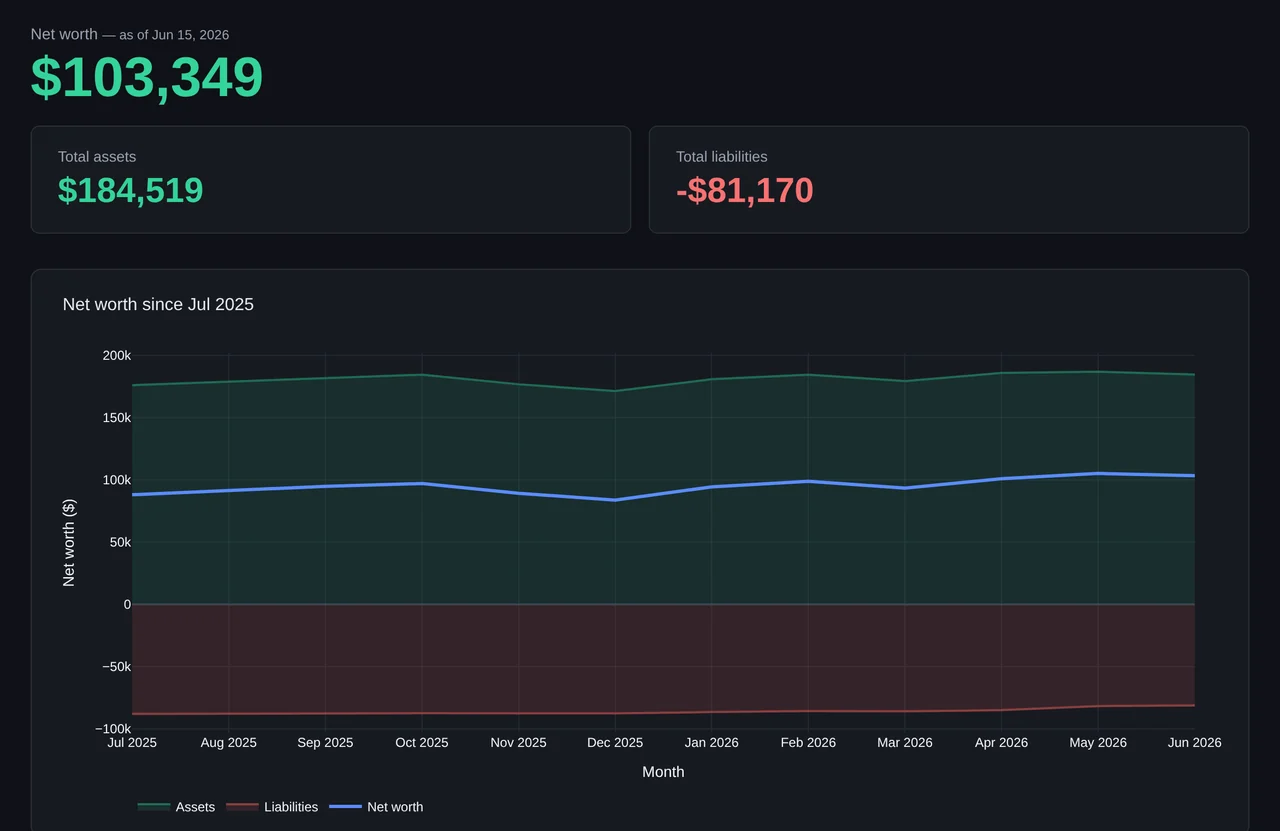
Balances from every account Tiller syncs, plus what it can’t see: a house, a car, a mortgage, crypto, stock grants. Priced daily, tracked over time, and printable as a clean statement for your financial advisor.
Spread an annual insurance bill, or a gift meant to cover a year, across the months it’s for, so one month doesn’t spike.
Categories, transfer patterns and corrections live in YAML files you can read, compare and keep in git.
The report is a single HTML page. Open it in any browser, keep it in Dropbox, share it with whoever shares the bills.
How it works
Tiller, a subscription service, pulls every bank, card and loan into a Google Sheet, every day.
It reads the sheet, categorizes each transaction by your rules, matches the transfers between your accounts, and keeps it all in a local database.
One self-contained page, rebuilt whenever you sync. Or open the web app to sync, recategorize and fix things in place.
rhe·o·graphREE-uh-graf
From the Greek rheo-, “flow” (as in rheostat), and -graph, “something that writes.” A flow writer: Rheograph records how money moves through a household, and charts it. The mark is the Greek letter rho, ϱ, for rheo-.
Every number in the demo is invented. The report isn’t.